2022 Running Review
2022 Running Review
TLDR: A data driven review of my 2022 running log and plan for 2023. More about my Ultra journey: https://hupili.net/ultra/[1] .
2022 Key stats:
•90% days active
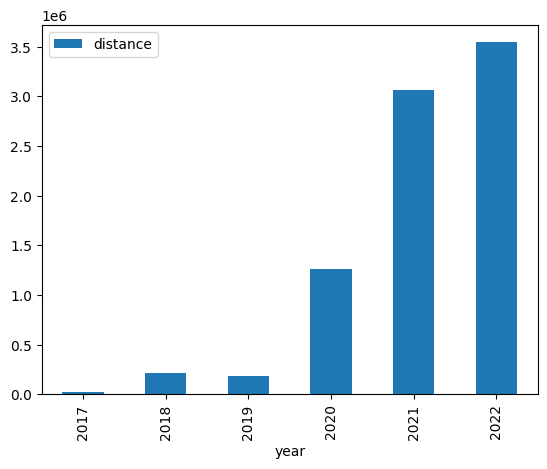
•3900K distance
•110K elevation gain
•Aerobic efficiency improved by 12%-14%
•+40% long runs over 40K
2023 Focus:
•Exercise 20-30KM at various intensities (HVL Tue[2])
•Gradually make LSD in 40-70KM range a routine on weekly basis (EOY goal)
•Strengthen speed works in 10-15KM range (need a coach)
•Gain race experience
Training philosophy:
•Casual at micro level to follow the body's direct feeling. Rigorous at macro level with statistics to direct training direction.
•Use all kinds of measurements to track progress, but do not "hack" a single KPI. (One can improve vo2max or Strava fitness score in a short time without being fundamentally stronger).
(horizontal) Distance by year
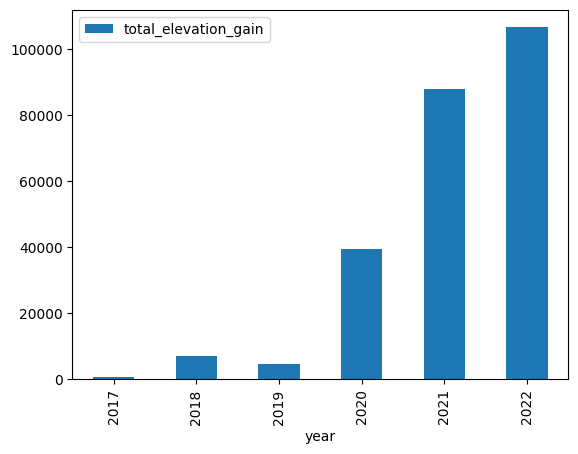
Elevation gain by year

Adjusted distance (equivalent distance) by year, 100m ascent = 500m distance
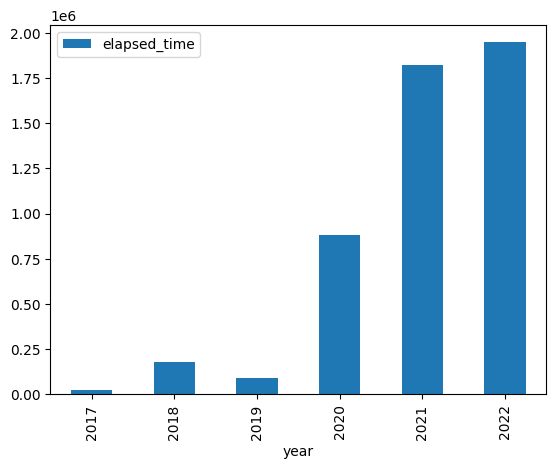
Elapsed time by year
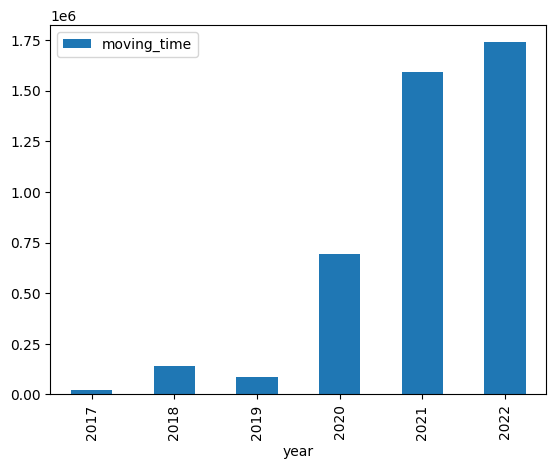
Moving time by year
Percentage of moving time over elapsed time:
•2017 0.789267
•2018 0.789879
•2019 0.906119
•2020 0.786598
•2021 0.872927
•2022 0.892461
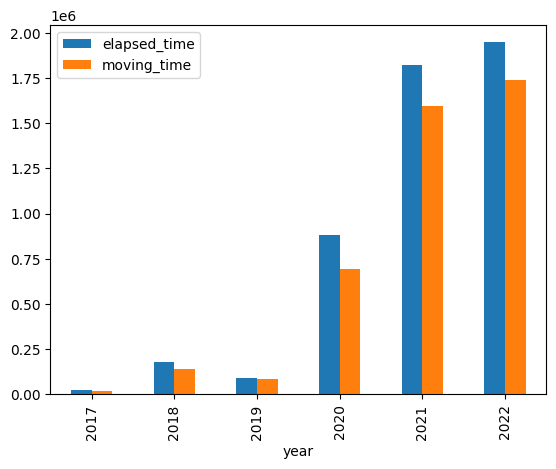
Moving time v.s. Elapsed time
78% seems to be the golden ratio of a hiker. 90% seems to be a golden ratio of an average runner. I mainly hiked in 2017 and 2018. In 2019, my work schedule becomes very tight so I could only run short distances occasionally. 2020 is my year of restart for fitness. I started with many social hikes, so the ratio degrades to 78% again. In 2021, I changed my running pose and could gradually run ("never walk" mod) for 20KM. In 2022, my comfortable jogging distances increased above 30K, so the ratio is further improved.
Pete Riegel curve is widely used by endurance athletes to forecast performance of longer distance running given shorter distance tests. The rough idea is that average speed reduces by about 4% every double distance.
I don't have a rigid training plan. My day to day training is mostly spontaneous. Over time, I organize my training data points around the Pete Riegel formula to target. The idea is that, if there is a certain <distance, speed> I want to target, I shall comfortably run a shorter distance with higher speed, or longer distance with lower speed. If there are enough points to "support" the curve at different distances, it is more probable I can reach the target.
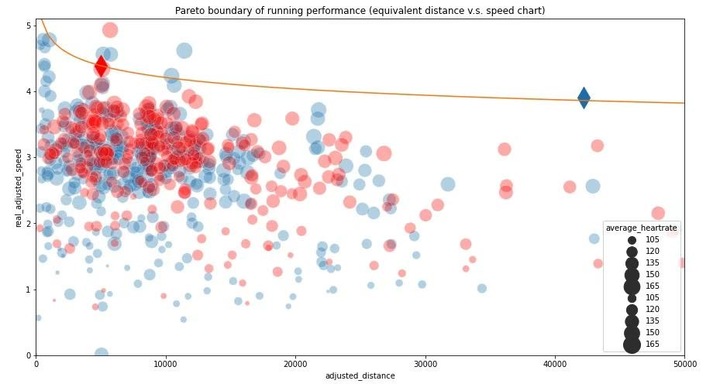
Pete Riegel curve on 3:00 full marathon

Pete Reigel curve on 3:30 full marathon
It shows that a 3:30 full marathon should be well under my reach (with lots of support; actually I had already run a casual 3:40 in LSD).
On the other hand, a 3:00 full marathon is theoretically possible by aerobic capacity, given my 5K TT of 19:10 (red diamond in 1st chart), but practically an impossible goal, as there is no support around the curve for any distance beyond 5K. I could easily run into other issues, like dehydration, de-electrolyte (cramp), low energy (fatigue), muscle damage (sore/ cramp), over longer distances.
The key idea of the Pareto Frontier analysis to set a proper target is to observe what is possible when everything is right (red diamond + Pete Riegel curve), versus highly likely even if something goes wrong (data points under the curve).

Pareto boundary by year
It shows that I have better coverage of 40-50K (adjusted) distance in 2022. This range was no longer a stretch goal that I needed to thoroughly plan way ahead. Instead, it became a routine distance I could pick up spontaneously. On the other hand, I lack high intensity runs between 5-10K, compared with 2021.
Those charts plot average HR v.s. Average Speed and draws a regression line for each year. We shall expect a positive correlation in general, i.e. the higher heart rate the faster. The key is to observe the change by year:
•Does the slope become sharper? I.e. becomes more efficient in recruiting intensive energy.
•Does the reg line become higher? I.e. given the same energy consumption (heart rate), the speed is higher.
We organize the charts into facets, to see how it progresses at different distances.
The adjusted speed is based on the adjusted distance divided by elapsed time. The adjusted distance converts every 100m ascent to 500m distance. The common wisdom is to convert every 100m ascent to 1000m distance as a way to measure effort. Note that many beginners find uphill more effort, because of a combination of reasons from energy consumption, to muscle strength, to terrain condition. Based on the VO2max estimation formula from Exercise Science[3] by Dr. Robert S. Mazzeo, the conversion is 450m when all other factors are dismissed. I use 500m for a simpler calculation.
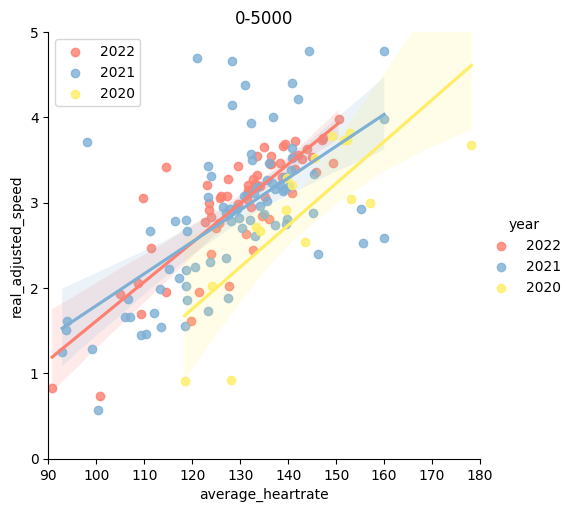
0-5K distance, HR v.s. Speed by year
Note that there could be some nuances for short distances. When it is too short (both distance and time), the heart rate may have not ramped up yet. Or the readings from smart watches may be lagging. 0-5K facet is for the completeness of statistics, but less of a good reference.
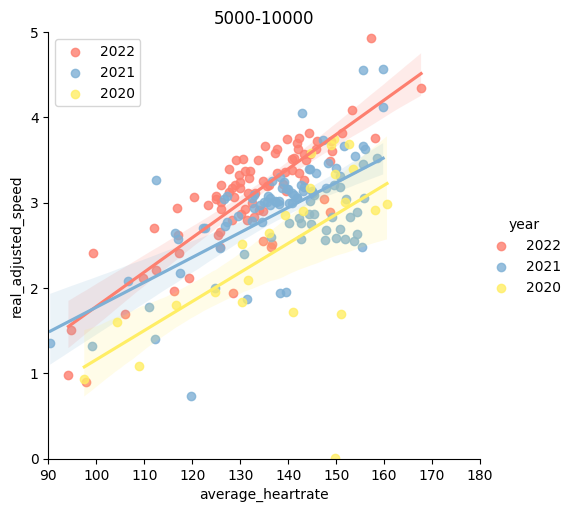
5K-10K distance, HR v.s. Speed by year
For 5K-10K distance, the intercept and slope are both improved from 2021. It is a good sign that I can recruit more intensive energy in this zone. Although I had less speed works/ time trials in 2022 than 2021, data predicts that I could do much better.
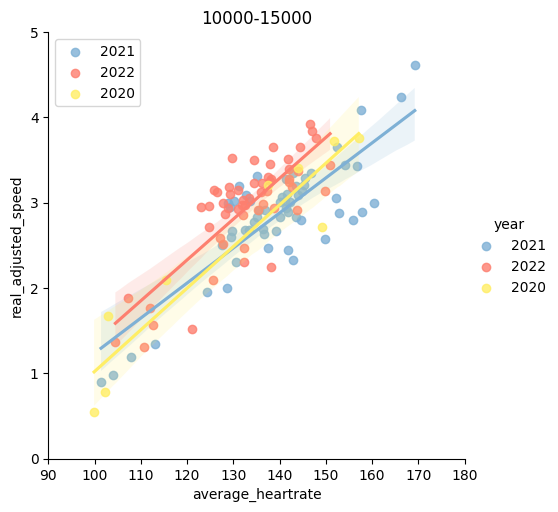
10K-15K distance, HR v.s. Speed by year
10K-15K is an emphasis of my 2022 run and the pay-outs are obvious. The intercept of 2022 is higher meaning that I can stably output more efficiently in this range. However, I had less speed works in this distance zone and I had not trained for intensity in this zone either, so the slope is not quite improved. This implies that, although theoretically I had a better base, I still risk diminishing returns when the intensity increases.
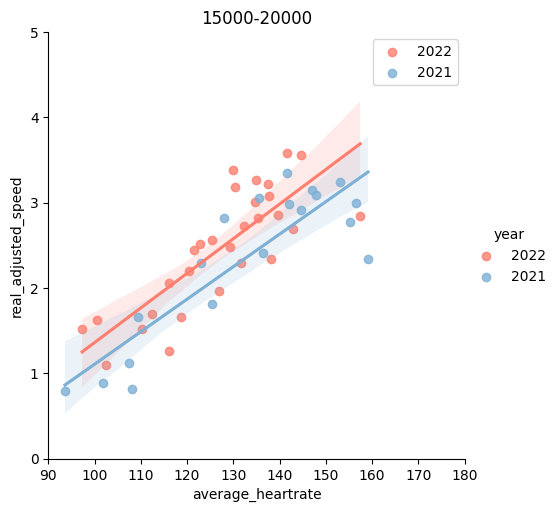
15K-20K distance, HR v.s. Speed by year
This group of curves looks similar to the above one.
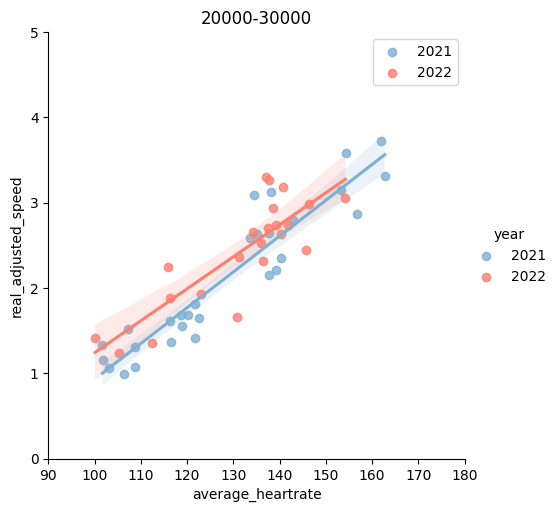
20K-30K distance, HR v.s. Speed by year
For 20K-30K, the two curves are entangled, showing no apparent improvement.
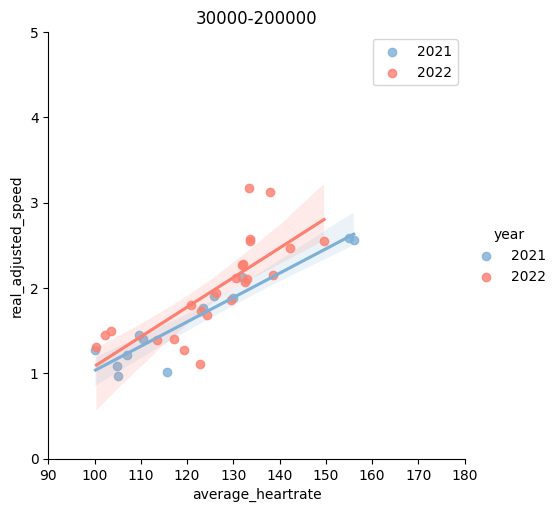
30K+ distance, HR v.s. Speed by year
For 30K+, the improvement is significant. Note that 30K+ was not a regular distance for me at the beginning of 2022 (now, kind of regular). Those run took more significant time and plan. Also they happen all around the year across sharply different weather conditions. All in all, the variance of 2022 data points is large. Apart from the statistics front, a few key data points are also testimonials of the training result. There are two red data points in 130-140 range and y positions are very high. In layman's words, I could use 130+ HR to run 6min pace over a distance of 30K.
To wrap up this section, we find HR=150 point on the regression lines and see the improvement from 2021 to 2022:
•(0K, 5K]: 3.66 --> 3.91. Gain: 6.78%
•(5K, 10K]: 3.23 --> 3.80. Gain: 17.46%
•(10K, 15K]: 3.29 --> 3.76. Gain: 14.42%
•(15K, 20K]: 3.01 --> 3.39. Gain: 12.52%
•(20K, 30K]: 3.03 --> 3.12. Gain: 2.89%
•(30K, 200K]: 2.46 --> 2.82. Gain: 14.54%
It shows a robust 12%-14% gain, which conforms to my observation by reading the meters during runs. The 20K-30K is an exception. It is hardly true that I improved for distances <20K and >30K, but not for distances in between. I think this is due to lack of data points. Although it is no much to worry about, I still need to add more data points between 20K-30K primarily because this is a "weird distance" I am less adapted to. On weekdays, I keep distances <15K. For weekends, I tend to make it even longer.
My goal from the very beginning is Ultra, since reading the Book Born To Run notes[4] in Dec 2020. I could not run a half marathon then, mainly due to muscle strains around my knees. I spent 9 months changing my running pose (forefoot → vertical landing → pulling), each 3 months, and every time started with a sharp speed loss. Compared with having a PB over certain distance, being able to manage long runs and have more long runs is a more appreciated testimonial to my training efforts.
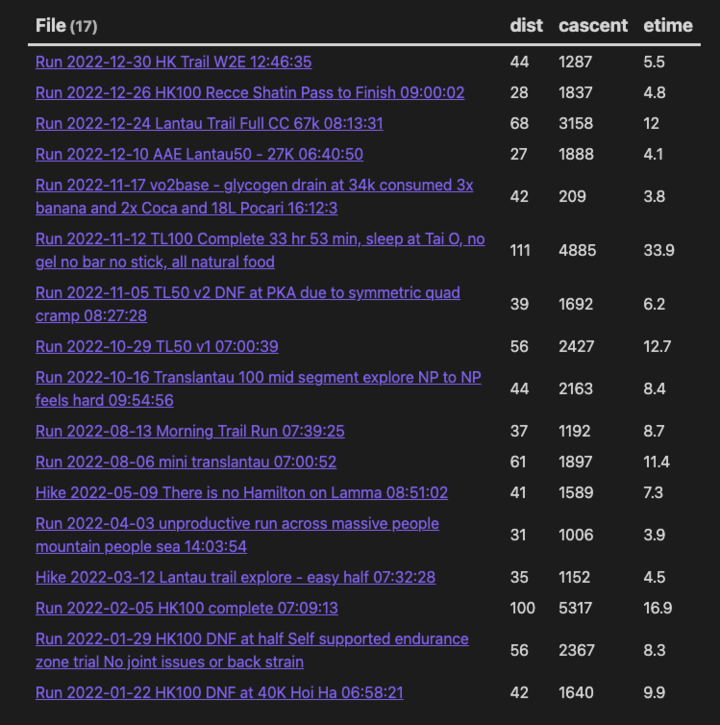
2022 > 40K runs
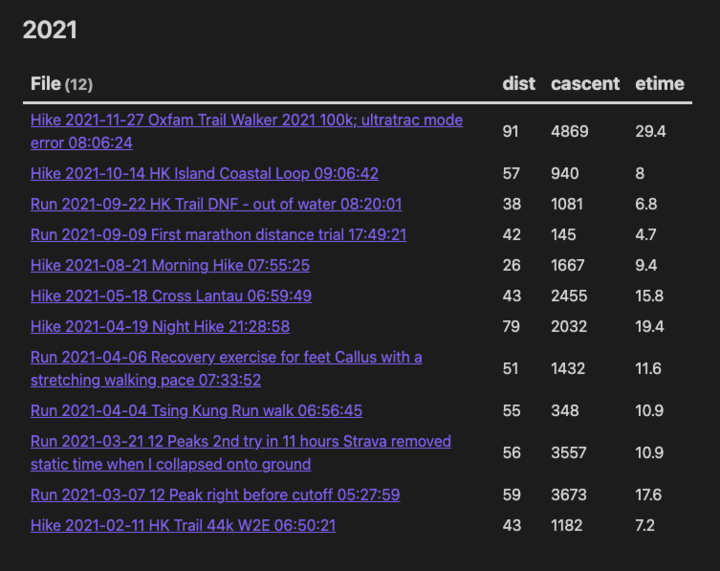
2021 > 40K runs
There is a 40% gain of long distance running.
•[1] https://hupili.net/ultra/: https://hupili.net/ultra/
•[2] HVL Tue: https://hupili.net/article/nft-happy-valley-laps/
•[3] Exercise Science: https://hupili.net/article/ultra-notes-exercise-science-101/
•[4] notes: https://hupili.net/article/ultra-notes-born-to-run/